Three lessons from my 15 years on Twitter

Today is my 15th year on Twitter. The medium has changed a lot over the years. More importantly, it has changed me. And society. Here are my thoughts.

1. Twitter’s history has been a dance between innovative users and its sometimes canny developers

The above post on this blog was from its very early days. Twitter was born of SMS, that 140-character text capability that was a biproduct of cell service. The character limit wasn’t alone in suppressing adoption. So was the fact that early cell phones, pre-cell-based-broadband, actually charged you once your texts exceeded a certain monthly maximum.

I was new enough on the platform, following pitifully few people and being followed by fewer, that this never phased me. But it was a problem for danah boyd. She is was anthropologist studying (at the time) youth and technology, before she left academia to work and publish at Microsoft Research.

boyd’s thoughts on the new technology called Twitter, which she encountered full-on at the 2007 South-by-Southwest, could be summed up in her blog post’s lead: “SXSW has come and gone and my phone might never recover. … To the best that i can tell, i received something like 3000 Tweets during the few days i was in Austin. My phone was constantly hitting its 100 message cap and i spent more time trying to delete messages than reading them.” (danah admitted at the time she was under the heavy sway of ani difranco, and her capitalization habits reflected it and still do.)

Twitter’s developers solved this problem within the year, by developing an app-based approach to following and reading tweets. But other innovations came from the users themselves, notably the invention of the hashtag. It was proposed by Chris Messina, late in the summer of 2007:

Adoption spread quickly, and soon Twitter had built an easy search mechanism for hashtags that we all take for granted.

2. Twitter has fostered grassroots revolutions and community-based journalism

I feel privileged to have witnessed history as it unfolded. One example is the Arab Spring of 2010-12, where, especially in Egypt and Tunisia, Twitter and Facebook helped to organize protests and, in cases such as Libya, take down dictatorial regimes.

Closer to home, I recall following the updates about the pursuit of the Boston Marathon bombing suspects nine years ago from two screens: My television, tuned to CNN, and my cell phone. As reporters on the ground, and copters circling the neighborhood where the bombers were hiding, were frantically speculating where they could have disappeared to, people I followed on Twitter were already, correctly, speculating they were hiding under the storage tarp of a boat parked in a driveway.

3. Forging friendships and business associations I never could have had

Especially since I quit Facebook, in light of the company’s egregious disregard for member privacy and spreading of fake news, Twitter has been my primary social media app for deepening some friendships and forging new one. Especially when I return to my old stomping grounds in Milwaukee, I often connect with people I have gotten to know on the platform extremely well. Twitter friends only, it’s been fun to meet them IRL.

I’m reminded that “adulting” often gets in the way of making new friends. Twitter has helped me in that important aspect of happy adulthood (and helped me familiarized myself with a ton of coinages such as IRL and adulting!).

Where from here?

These are the three bright spots on what could be a condemnation of social media. But I’m not Pollyanna. I am reminded daily of how Twitter has contributed to the disassembly of professional journalism and proliferation of filter bubbles, leading to no shared community or belief in things that are unquestionably true.

But what strikes me today, on the very day I first registered on the platform, is how much Twitter has contributed to my life, and the course of technological, social and geopolitical history.

Using Google Analytics’ New Report Dashboard

My work with Accenture has meant this blog has been silent since I joined. I’m loving my work there, by the way. But as for the central focus of this blog, I’ve been continuing to have fun in my off hours with web marketing analytics, especially using Google Analytics. If you use this app, you know they’ve launched a major upgrade of their reporting. It includes a way to create custom dashboards. Below you’ll find one small way I’ve used these new custom dashboards to save time and gain valuable insights.

Until I joined Accenture I was one of the contributors to Jason Fall’s exceptional social media marketing blog, Social Media Explorer. I miss being in such terrific company (they haven’t kicked me out of their Facebook group, something I’m very pleased about). I also miss those posts and the greater audience they had afforded me for my ideas on measuring social media.

But all was not well. I had always wondered how often people viewed my posts, the way I can with this blog. Yes, I could see which posts were the most likely to go viral. I could get that like anyone, from this summary of all of my posts there.

Then Jason shared with his contributors full reporting access to his Google Analytics metrics. Heaven!

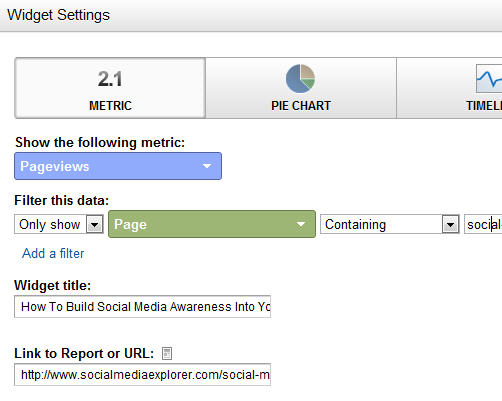
Now I had a different problem: I could see aggregate information, but there was no easy way to view just the information about my pages. If the structure of the site had been, say, “domain.com/jefflarche/blogname,” I could view only the pages starting with /jefflarche/. That’s not the case, though. So I walked away, vowing to someday find a way to create a report that would give me a breakdown of my posts, at least for the KPI of Page Views. I got busy today by creating a new Dashboard for the profile. I then populated it with Widgets. Here you can see what the set up looks like for each widget I added (one per post):

Below are the steps taken in this form:

  1. I chose the widget called “Metric.” This shows one number only (along with a couple of others, for context), instead of a chart, a timeline or a table
  2. I chose the metric of Pageviews. But I needed to add a filter. For that, you can see I chose to only show the count for pages that contain a unique string. For this example, I chose the unique string social-media-awareness-measurement/ portion for this post’s URL
  3. I gave the widget the title of that post and linked to it so reviewing content for hints of popularity (or lack thereof!) would be easier

Pretty easy, no? Once I had added a widget for each, this is what I got:

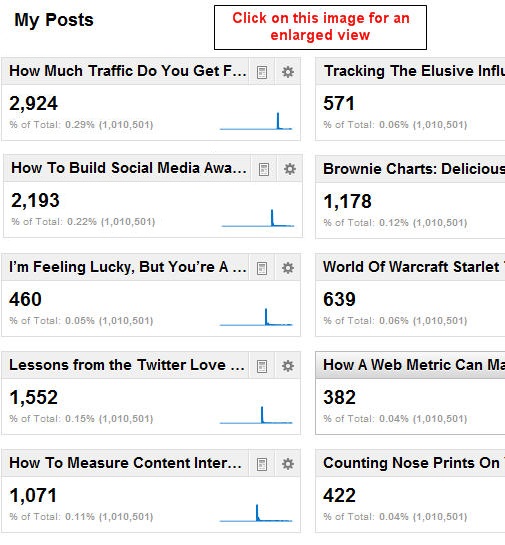
So what insights can I glean from this? First of all, it took a while to build an audience. I learned as I went along, from the first post (lower right corner) to the latest (upper left). I knew this from other measures, which made it particularly sad for me to walk away from the posts. I saw a growth for 693 percent, comparing the views my first post got versus my last.

Turning Information Into Insights

Here are other insights:

  1. People love “how to” content, and respond to headlines that contain those magical words. (I knew this from my direct response days, but it’s cool how thoroughly this has been carried to the online world.)
  2. People like to read reviews of relevant books. That’s what I did with the extremely popular post Lessons from the Twitter Love Guru
  3. Sparklines can give valuable hints to user habits

This last one isn’t readily apparent. I’m going to assume you know what a sparkline is and just say that each of them above shows a sharp rise and fall in readership. After the week it has been posted you can see the view plateau very near zero. It’s to be expected. But there was an outlier, which you could only see if you viewed the full report. It’s shown above right.

Not only did this post not immediately “click” with readers (look at the leading tail), but once it did, its tail at the end is thicker, showing more ongoing popularity. If you’ve been a reader from the start, you’ve already read here and elsewhere about The Long Tail. Here it is in action!

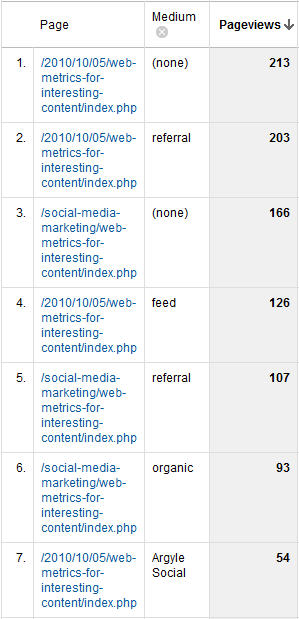
This odd sparkline caused me to dig deeper, and I saw this report for all sources of visits to that page since it post (to the right).

It shows a significant number of links from referring sites and search engines. The referrers obviously liked the content enough to send their readers to it. And search engines? This is the ultimate long tail. I even got four visits from Google for the phrase “measure if people share your content on social media.” Believe it or not, this is hotly contested (I no longer show up for this phrase — at least in the top three pages).

By the way, “feed” stands for Feedburner, which means the fourth (or third, depending on how you look at it) source of visits is people who read Jason’s blog using an RSS reader.

As I said, it pays to be in cool company. By the way, here’s a shout-out to Argyle Social. They’re right near the top as a source for clicks to this page. Their latest post, Is Post Automation Effective? particularly fitting. I would say certainly say yes!

A Link To All of My Social Media Explorer Posts

If the headlines of the above got you curious about my content, I encourage you to visit this summary page, with links to all of them. I’ll be watching this new dashboard to see just how many of you do!

Studying a Twitter ecosystem one user at a time

If you’ve been following my (roughly) monthly posts on Jason Falls’ blog you know that I’ve taken this tack: On his blog I cover the key concepts of a particular web analytics approach, then provide additional support for that idea here.

A recent example is from two months ago. I posted about the use of Brownie Charts as a way to report Content Interest Index. I posted a parallel piece here on another use of the technique (Using Brownie Charts to Measure Bounce Rates). You could say this blog has become my laboratory: Results of preliminary experiments are described here, while the “real” story is broken on Jason’s blog. Tomorrow will be a little different.

Tomorrow, on Jason’s blog, I’ll be posting on someone else’s innovation. It is a review of an extraordinary book: Hashtag Analytics. I’m a huge fan of its author, Kevin Hillstrom, and over the years I’ve spent way too many hours creating Excel-driven models in order to replicate and fully understand his findings.

I’ll be doing that again, this time in support of Kevin’s approach to monitoring Twitter communities. Check back at this tag (hashtag-analytics) to read updates on my “lab work.” Ill be reporting over the next several weeks.

When A Hashtag Community Member Is “Removed”

You may want to check Kevin’s blog as well — especially later this week, when Kevin reports on the future vitality of the hashtag community #measure.  He posted about it last week. Now he plans to theoretically whack an active member. Here’s an excerpt from his post, where he invites readers to suggest whom to “remove”:

In every e-commerce company, somebody is responsible for forecasting sales for the next twelve months, by day. So it makes logical sense that any community manager would want to know what the future of his/her community is, right? This is something you don’t find in any of the popular Twitter-based analytics tools. This is my focus. This is what I love doing, it’s completely actionable, and it’s an area of analysis not being explored!

Next week [the week starting January 24 — that’s today!], we’ll do something neat — we’ll remove one important user from the community, and we’ll see if the absence of the individual harms or helps the future trajectory of the community. If you are an active participant in the #measure community, please send me a user_id that you’d like to see removed in the forecast … I’ll run an example for the individual who gets the most votes.

And in two weeks, we’ll compare the #measure community to the #analytics community … competing communities doing similar work … which community is forecast to have a stronger future?

It’s a fun stunt / modeling experiment that has real world implications. It should serve as a proof of sorts of the predictive power of his Hashtag Digital Profiles and the statistical work behind them. More relevant to online community managers, it should illustrate why showing your participants “love,” lest they never return, is of tremendous importance.

What To Expect Here

I will be applying my own Hashtag Analytics to a different online group — one that has the advantage of weekly meetings. It’s a fairly new group, so the rules may not fully apply (Does an acorn sprout follow the same natural laws of growth as a full-grown tree?). To ensure I don’t jinx my test or influence the community — in a far more direct way than Heisenberg was referring to — its identity will remain unknown until I’ve gathered and analyzed a critical mass of data.

Do stop back.

January 25, 2011 Update:

Here are two related links I didn’t have yesterday. The first is Kevin’s post where he removes that member to the #measure Hashtag community. The second is my review of his book today on Jason Falls’ blog:

  1. Hashtag Analytics: Removing a Member of the Community
  2. Lessons from the Twitter Lover Guru

Join the Bum Rush for Charity Water!

I’ve been blogging about the book series Age of Conversation, and its affiliated Social Media Bum Rushes for charity, since the first one in 2008. I’m proud to have a chapter in their latest volume, Age Of Conversation III: Time To Get Busy. Within its pages I’m in extremely good company, with 170 other social media pros. My very brief chapter (really a micro-chapter, with a lower word count than most of my blog posts) is on social media analytics.

I am pleased to announce that we’re staging another Bum Rush today, on Blog Action Day.

Each year any blogger who wishes to participate in Blog Action Day writes on the same theme. This year’s theme is water. So let me tell you about Charity Water. It’s a nonprofit organization that brings safe and clean drinking water to developing nations.

Now, every sale of Age Of Conversation III: Time To Get Busy goes to support Charity Water and help developing nations get clean, safe drinking water.

How cool is that? Please join our bum rush. You’ll learn more about the power of social media, and become part of the solution to one of the world’s toughest health challenges.

How do you join the Bum Rush? Generate more sales of book at Amazon.com. Purchase it yourself and encourage others to as well. If you work for an organization that hands out Christmas gifts, get them to pop for multiple copies. They make great gifts!

One caveat: Please only purchase 1 copy at a time because Amazon.com counts bulk orders as one.

You can buy the Kindle version here (it’s the Charity Water affiliate link). You can get the paperback version here and the hardback version here (the other two Charity Water affiliate links). What else can you do? Here are seven ideas:

  1. Register for Blog Action Day.
  2. Blog about Blog Action Day and mention Age Of Conversation: Time To Get Busy. Use the same affiliate links that are in this post so that Charity Water can get its contribution.
  3. Join the conversation on Twitter. Use hashtags #aoc3 and #BAD10 for your comments about the book.
  4. Trackback or comment on today’s post about the Bum Rush at http://ageofconversation.com.
  5. Digg, Stumble and bookmark on Delicious.com all the posts you see about the event, including yours.
  6. Become a Facebook fan of Age of Conversation 3 (“AoC3“) and interact with us on Facebook.
  7. Send an e-mail to all your friends and get them involved too.

If we all band together and work for a common cause, we can make a difference. Join us in the bum rush on October 15, 2010 and help us raise money for Charity Water.

The time wasn’t right for Google Wave

One of the first adding machines was created in the mid-1600s. It took another two centuries before they were common in the workplace. Did adding up figures suddenly become more difficult or error-prone after two centuries? What exactly about numbers changed in the late 1800’s to make this new technology so suddenly appealing?

Of course the answer is that it was us who changed, not the fundamentals of math. To say we changed slowly is an understatement — in spite of the major economic improvements and workplace enhancements that came from their adoption.

It’s hard to imaging myself being one of those poor office clerks who added figures in his head all day, back in the so-called Age of Enlightenment. What I can be pretty sure of is this: A machine that does adding for you must have initially seemed far-fetched; even comical. How on earth could a machine do the work of the human brain? There must be some sort of catch.

Of course you know where I’m going with this.

Many writers of obituaries for the soon-to-be-euthanized Google Wave have said it was a slick solution lacking a problem. It therefore died of neglect.

I agree that it lacked a critical mass of users, but I disagree with the “lack of problem” assertion. Google Wave did real work, and it did it in a way that was flawed but thrilling for the vast potential it represented. At least, it thrilled me.

Ever since the mid-1990s, when I read the book of a very young Michael Schrage, No More Teams!: Mastering the Dynamics of Creative Collaboration, I realized that there were many barriers to good workplace collaboration. Chief among them was technology. Especially back then, personal computers were isolating machines. They forced us to relate with a small screen and a single keyword.

One of his observations was that before we could take the next incremental leap in teamwork, we needed a revolution in the technology that supports us. Of course he was right, but his pronouncement overlooked another barrier: We might be handed the technology we need to collaborate in a networked age and its environment so unfamiliar that it is almost universally rejected.

A year ago I predicted that we would be working within something like Google Wave “in two years.” I seem to have missed in that number by a factoring error of 10 — maybe even 100.

That would put adoption of the Wave at 200 years from now. In the meantime, I guess we all continue to add up columns by hand and grouse about our dreary workaday lives.