Web design tips to get the most out of Google Analytics

If you’re redesigning your site, or working on a redesign for others, isn’t it time to stop and think about how you’ll be measuring success? Follow these six guidelines to ensure that the output of what you produce won’t be left to guesswork. These recommendations will help you design your new site in a way that works well with Google Analytics.

What if you’re not using Google Analytics to measure traffic? Most of these tips are equally applicable to other JavaScript driven, “cookie-based” analytics systems. Ultimately all these systems can all use a little loving attention during a site’s design!

1.) Add Google Analytics scripting to all pages

Every page that you’d like to measure needs to have the GA scripting appearing somewhere in the code. It’s often omitted from pages that load in “real” pages using iFrames, or other pages such as obscure forms. This isn’t a problem until you need to measure these page loads as steps to a GA “Goal” (what Google calls a conversion). Sometimes this page even becomes the Goal itself.

2.) Try not to convert on another site

In other words, if possible avoid having a call-to-action point people to an extranet, or some other site configured exclusively for processing transactions. Instead, always strive to have those actions take place on the same site, with pages that are fully coded for GA monitoring. Otherwise, you bring visitors to the point of converting and Poof! They’ve left you. Then you’ll have trouble measuring those conversions in the Google Analytics reporting.

3.) Choose AJAX over Flash when possible

GA is driven by JavaScript data that’s delivered off of HTML pages. Combine that with the fact that AJAX is fundamentally JavaScript and you won’t be surprised to read this advice. Sorry, Adobe Flash!

What’s more, with HTML5, Flash is becoming even less crucial when you need to deliver a high-end presentation experience. Of course, somethings there is not option.

When you must add Flash, and it often happens, be sure you’ve included code in the Flash ActionScript to gather the right data and pass it to the JavaScript surrounding the Flash embedded file. If that all sounded like Martian, relax. Then show your developer this post on how to integrate GA into Flash.

4.) Ensure each of your page titles is unique — and yes, give each page a title!

Does this look familiar from the search engine optimization advice you’re read? It happens to be one of the most important things you can do to help search engines. You’ll recall that search engine optimization (SEO) experts also recommend you load these <title> tags with keywords that matter from an SEO perspective. But that’s not why I recommend it here.

Name your pages uniquely and it will be easier to generate user-friendly reports of page views and pathways in GA. In many places on the dashboard, Google Analytics’s reporting allows for real names of pages to be listed, instead of web addresses.

This wonderful feature is sorely underused because so many sites have duplicate page titles — or too many pages with no titles at all!

5.) Ensure one URL per page

Some sites include two or sometimes more web addresses for many of its pages!

Here’s a hypothetical situation. If a webmaster of a site wanted to give a blog contributor a more user-friendly (and search-friendly) profile page, they might use a redirect. For instance www.mybusiness.com/display.asp?ID=463 might become www.mybusiness.com/writers/bill-smith/ That’s awesome, but I’ve personally encountered businesses that accomplished these friendly web addresses through sometimes hundreds of redirects that aren’t at the DOM level. It takes a 301 or 302 to do that DOM level change, which is the only way that GA can log page views correctly. By using other types of redirects to create these new page URLs, the webmasters create a mess in GA!

Imagine: How do you measure page views and much else, when GA reports one number of views for the first URL, and a second number of views for the second, both for the very same page? The answer is you either have to add them up, or hope webmasters followed #4 and used truly unique page titles. Otherwise the consequences is a ton more work extracting good data and a limited scope of what you can report!

Here’s a great post from Google on 301 and 302 redirects and their effect on Google Analytics.

6.) Create Logical Page / Folder Hierarchies

Google Analytics reports best when pages are organizing by folders — either real or generated (using those 301/302’s and a smart set of rules). That example above could have pages along this organization:

www.mybusiness.com/products/display/

www.mybusiness.com/products/maintenance/cleaning/

www.mybusiness.com/products/maintenance/repair/

You get the idea.

The consideration of folder names and levels is extremely important, not just to help humans and search engines, but to make your reports in Google Analytics a little easier to understand. They sometimes make the reporting more accurate.

Note: These folding level are NOT necessarily reflective of the navigation within the site. It is not necessary that they coincide perfectly. This foldering protocol would be purely the URLs displayed in the browser address bar, and nothing else. You could have differences in, say, the breadcrumb navigation displayed on each page.

Are there others I missed?

Those are the six more obvious rules for designing sites to work best with GA. Your comments on other ways are always welcome.

One final tip

Here’s a terrific post for the Google Analytic power user, to help find and fix duplicate page names, or to provide in reports both a page URLs and names.
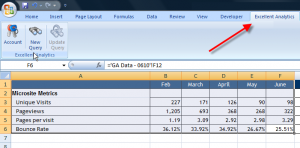
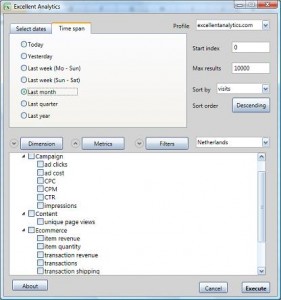
Dashboard liberation: Excellent Analytics moves Google application to Excel

Although it’s easy to bash Microsoft, over the years a handful to tricks have made me an avid fan of Excel. Pivot tables and relational look-ups (all hail VLOOKUP!) are two arrows in my web analytics quiver. I’ve just added another. If you work in Google Analytics a lot, you should too.

Excellent Analytics is a free Excel add-in that truly lives up to its name. It allows you to run queries to Google Analytics’ API right from Excel, and publish its results there.

Say goodbye to many of the “Save to Excel” hassles that used to come with wishing to share and chart Google Analytics results beyond its powerful-yet-limited dashboard.

Go to Excellent Analytics now and give it a try. You’ll need Windows Vista or greater, Microsoft Office 7, and Windows .NET Framework 4. Give yourself a couple of hours to install and learn the system. Then start publishing, charting and sharing. You’ll fall in love the way I did!

Measuring your business blog’s success

This afternoon I gave a presentation on business blogging, as part of SOHObiztube.com’s The Draft, an all-day social media workshop.

The last part of the presentation was on my favorite tools for monitoring conversations, as well as the conversions that a business blog initiates. Here’s the list:

Google Analytics — This is still my favorite way to monitor all blog activity. It is fairly easy to configure, it provides a great way to measure conversation (Google calls them “Goals”) and offers benchmarking with other blogs. Price: Free

Technorati — This site provides simply but helpful ways to track the growth of your site, by comparing its “popularity” to others and showing all backlinks (also known as “pingbacks” to your blog from others. Price: Free

CrazyEgg — This is new to me, and admittedly untried. But I like their visualization tools. The one below is a heatmap showing likelihood to click (not to be mistaken for an eye-scanning heatmap). Price: Plans vary in cost

Crazyegg.com Heatmap

Feedburner — This service, which was acquired two years ago by Google, is an industry favorite for monitoring how many people subscribe to you. It even has a badge, showing the number of subscribers you currently have. If you are reading this near the day it was published, you’ll see that the current theme of my blog displays the badge near the top of the righthand column of every page. (As of this morning, I had 365 subscribers. Thank you one-and-all!) Price: Free

There. That’s my list. What’s yours?

I had a great time talking to the group today, and invited them to post their questions about business blogging here in the comments section. I’m also inviting all of you to let me know what your favorite blog measurement tools are. I’m especially curious if you’ve used the CrazyEgg product line-up. If so, what do you think of it?

Related posts:

Measure clicks and ROI from Twitter posts

A week ago I was a co-speaker at a C2 Five Dollar Friday event. One of the last items I touched upon was how to measure traffic that comes from Twitter and other social media posts. I promised the group that I’d document the process.

Note: Get news on my expanded web design ROI workshops, to be held by C2 in Milwaukee and Madison.

Twitter As A Channel for Sales

It wasn’t too long ago that there were no definitive examples of strong positive ROI from Twitter. Since then several high-profile companies have publicized their successes. You might have read a recent account of how, according to Forbes and other sources, a division of Dell Computing has earned over $3 million from sales generated from its Twitter posts.

Here’s how your business can accurately measure direct sales — or track sales leads — generated by this powerful communication channel. All you need is a free Google Analytics (GA) account and the following new GA profiles (a special thanks to eConsultancy for their terrific post on this topic in May):

1.) Track all clicks from Twitter and major Twitter agents

a.) Add a new profile in Google Analytics

Name this new profile something like Twitter Traffic. If you’re creating this profile significantly later than the rest your Google Analytics set-up, you can add a date to the profile name. That will help you know how far back in time your results reach. In this case I haven’t:

Step 1

Continue reading “Measure clicks and ROI from Twitter posts”

Two secrets to estimating digital communications ROI

Digital marketing has always been a paradox. It is two things simultaneously: Extremely expensive and nearly free. It is pricey because the skills needed to stage digital campaigns and “collateral” are still rare compared to those needed to stage traditional media efforts. And it’s free because once you’ve published the material, every incremental interaction costs a fraction of a cent. So how in the world do you estimate a digital return on investment (ROI)?

Here are two trade secrets. In honor of the fast-approaching close of the summer vacation season, I’m going to use a road trip as a metaphor.

1.) Focus attention on the speed of your progress and not on whatever city is currently outside your window.

Web metrics are notoriously untrustworthy. They may be off by 11.5%, or -18%, but of one thing you can be sure: They are never exactly correct. Living with this imperfection requires both a diligent focus on precision and a resignation to the medium’s inevitable “slop.”

Road Trip, Creative Common photo courtesy of Jim FrasierThe solution is to chart metrics over time, using the last period as a benchmark for this one. A saving grace of web metrics is that as imperfect as they are, they’re always imperfect in perfectly identical ways, month after month (assuming nothing technically has changed).

2.) Remember the cost of the car as you calculate what you’ve spent.

Break the costs of your trip into two: Fixed and variable. With the car trip metaphor, you need to remember that part of your costs are sunk into an asset. Whereas the gas, oil and accelerated depreciation come from the variability of the trip, the expense of the car itself is fixed — something you would have to pay even if you left the car at home.

In the same way, every communication is a contribution to the maintenance of a crucial intellectual property: Your brand. Whether you did nothing this month to burnish that brand, it is still an asset — a source of wealth. (Consider this: You can’t sell a vacation you’ve just had, but you can sell the car you took it in!).

You spent dearly in the past to get your brand where it is today, and you should acknowledge that every investment in communication that mentions the brand is like the replacement of a radiator hose or car battery. It helps retain the brand’s value.

Don E. Schultz and Jeffrey S. Walters, in their book Measuring Brand Communication ROI, used a different metaphor. They compared a brand to a physical property (instead of the intellectual property that it actually is). Should you stop spending every year on its upkeep, it will begin to crumble, and will eventually fall to the ground. In digital marketing efforts, this spending is a portion of every PPC campaign, every email blast, every social media initiative.

What fraction of your digital spending should be put toward the “car” and not the “gas and oil?” That’s the subject of another day. But simply shifting to this paradigm is progress.

Take these two tips to heart and you’ll be well on your way to reporting reliable ROI.

Are you in the Milwaukee area? Then you can learn more when I speak at C2’s September Five Dollar Friday. On the afternoon of Friday, September 18, I will be a co-presenter there, as part of an exciting exploration of “crucial web acronyms: SEO, PPC, SEM,” and — ultimately — ROI!