Make your charts more like maps

Pecha Kucha is Japanese for “chit-chat.” I’ve talked about the presentation style on my personal blog.

In a Pecha Kucha, the speaker is restricted to just 20 slides, and only 20 seconds per slide. It’s a 6 minute, 40 second burst of information. As for the one embedded below, here’s some context: Think of the various maps in your life. Mine come to mind easily. I see one every time I go home.

I have a map of the world on the wall of my apartment, with pins showing places I’ve visited and others for where I’d like to visit next, once this Covid nightmare ends. As you can imagine, it drives decisions and actions.

Another map is one we all have. It’s the small map in our phones, powered by GPS. That map drives decisions and actions every day.

But if you’re responsible for helping your bosses or clients understand data, what about those data dashboards or charts easily leads them to take action? In my experience, truly actionable charts are few and far between!

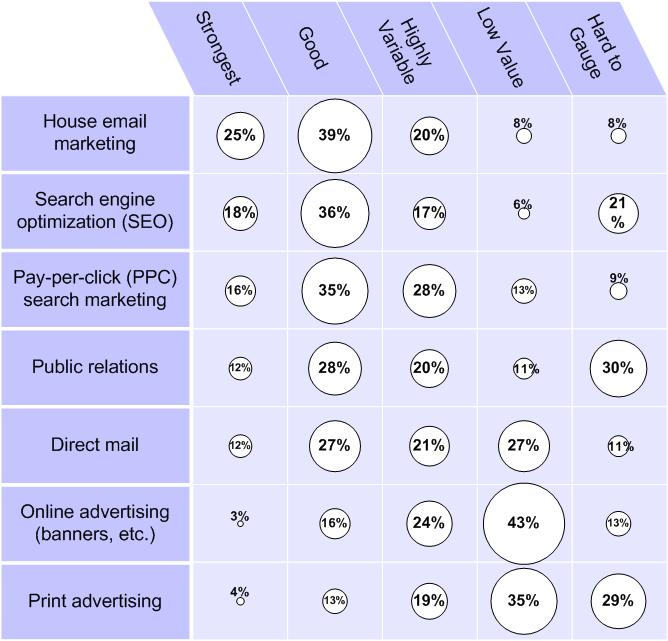
All too often our charts do not drive action

Why is that? In this Pecha Kucha, I explore that question, and show you how you can drive more consensus and action with your data visualizations by choosing and customizing charts to be more map-like. I pull two examples from my decades of experience as a marketing analytics consultant.

The data is all made up, but reflects real life business challenges, and how making your charts more like maps can help to bring your bosses or clients to decisions. And isn’t that what data-driven decision making is all about?

Enjoy.

World Cup win was also a triumph for Edward Tufte

The U.S. just won a pivotal game in the World Cup, and it was a squeaker. I “watched” it while working, using an amazing new data visualization app on the New York Times website. One tab in particular reminded me of the teachings of data visualization guru Edward Tufte. It showed an easy-to-read display of key game statistics, updated every 15 seconds:

The right column had a pull-down that allows users to see vital statistics about each player. The number of touches in the game, by player, is shown above. Others include fouls, cards, and of course goals (a list of exactly zero players at this point in the game!)

No, I’m not such a data wonk that I could feel like I’ve experienced the action by watching this view. But the other tabs at least gave me a hint at the action I was missing away from the television screen. Check these out, keeping in mind that you can see the latest action, and review the action that took place earlier, in a type of choppy animation, using the timeline player at the bottom of the app:

And here’s another:

Notice, at the very bottom of the graphic, the audio toggle. I chose to keep the app in the background, with the audio turned on. Throughout the game, the app was silent (thank goodness it didn’t pipe the vuvuzela noise through my computer speakers!) That is, the app was silent until that U.S. goal in added time. That’s when I heard a three-second burst of cheers. It was a cue for me to check the app and receive the thrilling news.

Edward Tufte believes the future vitality of business — and perhaps even of our species — hinges on how well we can communicate complex information quickly and intuitively. The Times has adopted many of his favorite techniques, particularly in the Finance and Sports sections. For example, those little sparklines you can find there were first made popular by Tufte.

This latest real time tracking of the complex game of world football (a.k.a. soccer) is a demonstration of how far we’ve come with data visualization, and an exciting taste of the future. Gooooaaaaallllll!

A novel way to make tabular data engaging

Regular readers know I’m a fan of the work of Edward Tufte, who the New York Times once described as The da Vinci of Data. The unifying theme of his many books and papers is finding ways to make complicated data simple and immediately understandable.

This is rarely easy. That’s why there is so much data presented in less than ideal graphical formats. Difficult-to-process-tables are one of the contributors to the Death By Powerpoint syndrome.

Is boring your audience a crime? No. But especially in an era where so much is changing so fast, the need for nearly instant understanding is even more important. There must be understanding of the facts before the right decisions can be made. Obviously, companies whose people make decisions based on what’s really happening have a significant competitive advantage.

Reshaping How Information Is Shown

I was reminded of this when I looked over an old post, Survey of marketing tech types finds ROI strongest for search and internal email tactics. Its source was this table of survey information, from eMarketer:

roi_tableConsider this the “Before” example, to be compared with the image below.

I found the insights in these survey results interesting and occasionally downright provocative. (You can click on the link above to read the observations that I thought were worth discussing.)

My problem: For me, at least, pulling insights from a table of percentages alone was nothing short of agonizing.

My solution was to convert it into this:

The Same Data Made More Understandable

Below is what I came up with (click for a slightly clearer version). After looking for other types of charting, I realized that the benefits of the table (many different comparisons can be made) could be combined with the benefits of a bubble graph (intuitive comparison of visual “volume”).

Perceived ROI by tactic, from 3,000+ search marketing pros

I don’t pretend to be a charting innovator, but instead present this as encouragement. If I can improve data using a simple graphics program (I used Visio), so can you.

Jeff’s first Pecha Kucha

It was actually Charles Dudley Warner — and not Mark Twain as is commonly thought — who first quipped, “Everybody complains about the weather, but nobody does anything about it.” Boring slideshow presentations come in a close second behind the weather for producing the most heat for the least real flame.

As I’ve noted here before, Edward Tufte is that rare exception. He’s written extensively on alternatives to the presentation status quo.

On the other hand, the inventors of Pecha Kucha tell the press that they have no goal more lofty than putting butts in seats at their Tokyo performance space. But I really think they’re onto something.

[youtube C_5l6hXwzUo]

As I mentioned a few days ago, I presented my first Pecha Kucha on Saturday, to support the discussion of a new web metric called the Content Interest Index. Today you can find it posted on YouTube (embedded above), to make viewing and sharing a little easier.

I hope to soon attend my first Pecha Kucha performance event in Chicago (the date is TBD), where I know the quality of the presentations will make me glad I didn’t quit my day job. But until I see what a real Pecha Kucha can do, I’m fairly happy with this quirky way to explore an otherwise “bland” topic. I’m also glad to do my part in “doing something” about the scourge that is SDD (Slideshow Deficit Disorder).