Adobe to buy Workfront: A big win for marketing throughput

Workflow management is often an afterthought. That’s a big mistake, especially when it comes to marketing execution. The late Eliyahu M. Goldratt told us this in his books from nearly forty years ago, starting with The Goal, and especially its follow-up ten years later, It’s Not Luck.

Those books are ancient business history, yet this proven competitive advantage continues to go ignored by most enterprises. I know. I’ve seen it in my many years of digital marketing consulting. But things are starting to change. What’s more, I consider Adobe’s announced plan to purchase Workfront as a sign that this progress is accelerating.

Let’s face it: Workflow management isn’t sexy. But following the adage of You can’t manage what you don’t measure, the pace of executing your marketing strategy can stall if you aren’t identifying and fixing constraints in the pipeline. That’s where Workfront shines. But first, a little more about how we got here.

The Theory of Constraints

Goldratt initially created his Theory of Constraints (TOC) because Western manufacturers were quickly losing ground to the Japanese makers of cars, televisions, and much else. At the time he maintained that improved throughput was a secret weapon for the modern manufacturer … and marketer. (He looked at several categories of workflow in his books, and devoted It’s Not Luck to marketing effectiveness.)

Speed-to-market — what Goldratt called throughput — reduces inventories, stabilizes costs, and helps a brand prevail over less-nimble competitors. Out of Goldratt’s work (along with others of his ilk) came entire categories of TOC-driven productivity, most notably modern logistics.

Let’s look at a common marketing example:

It’s a competitive no-no to take many weeks between conceiving a campaign and its execution, using a tool like (in this example) Adobe Campaign. But constructing campaigns in Campaign is hard work! There are so many skilled hands that must touch the work product, in sequence or in parallel — doing everything from copy writing and photography to graphic design, data science, coding and quality assurance (QA) testing.

Non-waterfall approaches to the work, particularly Agile, are, to use a phrase that is the title of another of Goldratt’s books: Necessary but Not Sufficient. Agile in this context is no panacea.

Achieving Spreadsheet and Email Escape Velocity

In order to move the work efficiently, you need to get everyone out of the tyranny of email threads and shared Excel spreadsheets. Managing projects of this complexity must be handled by a platform, with automated hand-offs and reporting.

I can hear some of you now: “We’re good. We have Jira to do that!” or “We have [the Microsoft Jira clone] Azure DevOps [ADO].”

Yeah, no.

Marketing involves more than technologists. It demands creatives, plus many layers of stakeholders. These folks haven’t the patience to learn the language and interconnections of those development and bug-fixing tools.

Workfront is the industry leader in providing a marketer-friendly solution. I’ve seen it in action. It can track campaigns, A/B tests, tagging, insight generation and much more. It does something else that would have warmed Mr. Goldratt’s heart.

Finding and Fixing Bottlenecks

You’ll recall that the “C” in TOC stands for constraints. And a constraint is just a fancy word for a workflow bottleneck. These are the slowest stages in the path leading to a successfully delivered project. Typically, Goldratt observed, you can only see one of them at a time. That’s because if you observe work piling up at a particular step, the system upstream slows, making other, upstream bottlenecks undetectable.

Thus the 5-step cycle that he described in his books, and is shown at the top of this post.

Another clarification: By “exploiting” constraints, Goldratt had simply meant opening up the log jam. In manufacturing, (and frankly, also in marketing project management), that can mean things like this:

  • Doing as much QA as possible before the constraint
  • Hiring a second resource
  • Adding a second or faster machine used to do the work

Once you’ve cleared one logjam, it’s guaranteed that will expose another. That’s just life in project workflow management.

You can do none of the work I describe unless you have the reporting necessary to see the bottlenecks. And if you’re using manual reporting today, just realize that won’t scale as capacity increases.

These productivity reports are where Workfront really shines. Marketing projects managed this way move through the system more smoothly and create an environment conducive to other improvements, e.g., unanticipated process innovations.

You cannot manage what you do not measure, indeed.

Managing Inputs and Outputs from Adobe Platforms

All of this is why I’m so pleased that a major digital experience company has decided to buy Workfront. Arguably every platform in the Adobe Experience Cloud has inputs and outputs that must be managed by many types of roles. By eventually providing a workflow management tool to knit together this work, the value of Adobe’s cloud will grow.

As a process guy, I’m loving this development. But let me know what you think. I’ve turned off comments, but I have an extremely “googleable” name. You can find me on social media and let me know your thoughts.

MindJet adds Gantt charting to its mind mapping software

I’ve been an advocate of mind mapping for years, and have recently talked about my preference for using MindJet.com’s mind mapping product, MindManager. I even demonstrated its power, while leading a discussion about rich digital media, at an UnGeeked Conference in May. I find the system a huge time-saver. Now MindJet has upgraded their software to include a valuable way to share project roles, deadlines and milestones: Gantt charting.

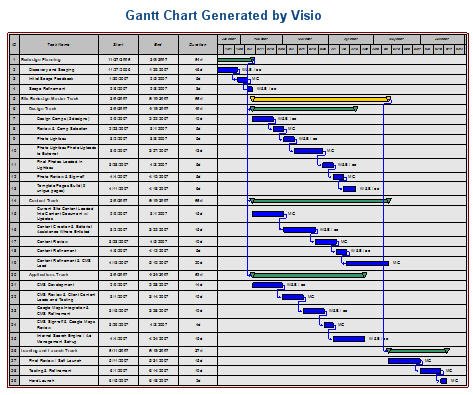
Since the 1990s I’ve appreciated the ability of Gantt charts to bring teams to agreement on project roles and deadlines. It’s an equally valuable way to show clients how any delay in supplying crucial content or sign-offs can push web launch dates out. Below is an example:

The detail is intentionally too small to make out, because I’ve used live client details. From left to right, this chart shows the task name, and start date, end date, and duration in days. After that is the chart itself. Milestones are the green bars. Every task within that milestone must be completed before the milestone is reached and the next milestone and task set begins.

My web development team would “own” some of the tasks, and the client would own others. At a glance, everyone knew what they needed to do and when. They also knew the effects on the project as a whole if they missed their deadline. Great stuff.

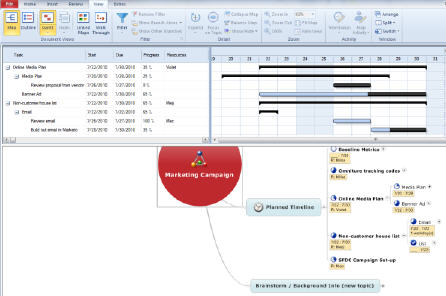
Now, the just-released MindManager 9 includes this feature. Below shows a simple Gantt chart, from MindJet’s introductory video:

Needless to say I’m eager to give the Gantt charting a test spin. What’s especially exciting is it takes the collaborative strengths of building a mind map as a team and fairly quickly converts that shared map into a full-blown project plan.

The time wasn’t right for Google Wave

One of the first adding machines was created in the mid-1600s. It took another two centuries before they were common in the workplace. Did adding up figures suddenly become more difficult or error-prone after two centuries? What exactly about numbers changed in the late 1800’s to make this new technology so suddenly appealing?

Of course the answer is that it was us who changed, not the fundamentals of math. To say we changed slowly is an understatement — in spite of the major economic improvements and workplace enhancements that came from their adoption.

It’s hard to imaging myself being one of those poor office clerks who added figures in his head all day, back in the so-called Age of Enlightenment. What I can be pretty sure of is this: A machine that does adding for you must have initially seemed far-fetched; even comical. How on earth could a machine do the work of the human brain? There must be some sort of catch.
Of course you know where I’m going with this.

Many writers of obituaries for the soon-to-be-euthanized Google Wave have said it was a slick solution lacking a problem. It therefore died of neglect.

I agree that it lacked a critical mass of users, but I disagree with the “lack of problem” assertion. Google Wave did real work, and it did it in a way that was flawed but thrilling for the vast potential it represented. At least, it thrilled me.

Ever since the mid-1990s, when I read the book of a very young Michael Schrage, No More Teams!: Mastering the Dynamics of Creative Collaboration, I realized that there were many barriers to good workplace collaboration. Chief among them was technology. Especially back then, personal computers were isolating machines. They forced us to relate with a small screen and a single keyword.

One of his observations was that before we could take the next incremental leap in teamwork, we needed a revolution in the technology that supports us. Of course he was right, but his pronouncement overlooked another barrier: We might be handed the technology we need to collaborate in a networked age and its environment so unfamiliar that it is almost universally rejected.

A year ago I predicted that we would be working within something like Google Wave “in two years.” I seem to have missed in that number by a factoring error of 10 — maybe even 100.

That would put adoption of the Wave at 200 years from now. In the meantime, I guess we all continue to add up columns by hand and grouse about our dreary workaday lives.

Twiducate concept is too good to stay in the classroom

Yesterday Naomi Harm give a keynote address at the Lake Geneva Schools Technology Academy, an educational event for elementary, middle school and high school teachers. Although I wasn’t at the event, word reached me about a social media-inspired educational platform called Twiducate. Similar to Yammer (“Twitter for intra-business communication”), Twiducate does not use the already overtaxed Twitter platform, but instead uses many of the principles that make Twitter so useful.

I took a test-drive of Twiducate last night, and two things struck me. The first revelation I had became the title for this post; The developers of Twiducate will be hard-pressed to stop work groups other than classrooms from using the tool. The other revelation is about education reform. Yes, reform won’t happen on its own. But certain facets of it will happen naturally, “seeping in” from the emerging social media zeitgeist. Avoiding new teaching environments like Twiducate will be like holding back a rising tide.

Here’s a video:

So: Will the subversion of this tool be harmful?

I think asking the question is moot. This type of thing will happen regardless. I’m thinking of at least two other examples of where a social network is forced to morph because of the unintended uses those pesky members decide to put it to.

  1. Fotolog.com started as a primarily photo-sharing site, similar to Flickr.com. But its meteoric growth in the last decade — especially in Chile, Argentina and Brazil — was due to users hopping on to connect and generally socialize. Sharing favorite pics became secondary.
  2. If the above sounds like dumb luck — like simply being in the right place with the right product (read: social toolset) — you’re right. And you’re also probably thinking of my second example. Although Mark Zuckerburg might posit that Facebook’s growth was all part of some master plan, we shouldn’t forget that he built it in his dorm, six years ago, as merely a “Harvard-thing” — primarily an easy way for him and others to organize study groups.

Check out Twitucate. Do you agree that it’s more than education’s new “Moodle-killer?” Does it have “legs” beyond academia, and is that a good thing?

Dashboard liberation: Excellent Analytics moves Google application to Excel

Although it’s easy to bash Microsoft, over the years a handful to tricks have made me an avid fan of Excel. Pivot tables and relational look-ups (all hail VLOOKUP!) are two arrows in my web analytics quiver. I’ve just added another. If you work in Google Analytics a lot, you should too.

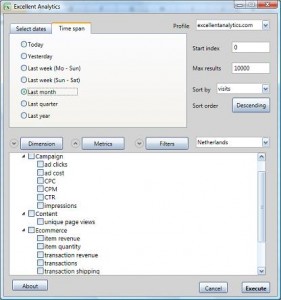
Excellent Analytics is a free Excel add-in that truly lives up to its name. It allows you to run queries to Google Analytics’ API right from Excel, and publish its results there.

Say goodbye to many of the “Save to Excel” hassles that used to come with wishing to share and chart Google Analytics results beyond its powerful-yet-limited dashboard.

Go to Excellent Analytics now and give it a try. You’ll need Windows Vista or greater, Microsoft Office 7, and Windows .NET Framework 4. Give yourself a couple of hours to install and learn the system. Then start publishing, charting and sharing. You’ll fall in love the way I did!