Mindfulness the Google way by Jon Kabat-Zinn

Merlin Mann is one of my favorite productivity bloggers. And similar to how you feel when you learn that two old friends have met and hit it off, I was pleased yesterday to read his post on an influential teacher in my life: Jon Kabat-Zinn, founder of the Center for Mindfulness in Medicine, Health Care, and Society.

At about the same time that I was gaining my stride in my professional life, a chronic pain situation nearly ended it. Then I learned about what this fellow was doing, deep in the bowels of the University of Mass. Medical Center. I learned about Kabat-Zinn and his “de-dogma-ized” meditation program in a segment of a PBS special, Bill Moyers’ Healing and the Mind. What followed is a journey I’m still on.

Read Merlin’s post, and check out the YouTube video it describes, which was shot on the Google campus.

April 1 Update: Here’s an account of the health benefits of this type of meditation, from yesterday’s BBC News site.

B-to-B Viral Marketing Case: Powerboat sales as a window to our current economic squall

Let’s say you’re a company that mines data in a quiet niche — one not known for analytic vigor. You’ve been doing it for years and do it wonderfully. For clients who appreciate your chops, you’re a godsend. But these clients are exceptional in the traditional retail business sector you serve.

How, how do you spread the word about your super-segmented lists and dead-on business intelligence services? Intuition says you find something to “go viral” around. But that requires some degree of topical relevance, if not outright sensationalism. How do you enliven something as dry as, say, boat purchase behavior (pun intended), to give it the life necessary to grab headlines?

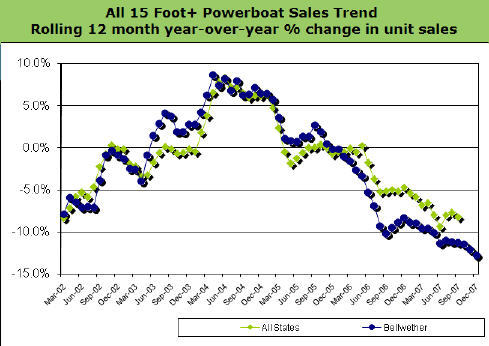
The answer is what Info-Link does. They periodically publish one of the more pedestrian metrics they track: Quarterly sales in bellwether states. Below is their latest Bellwether Report, available on their site and distributed via a simple but effective opt-in email:

Info-Link Bellwether Report

You can explore various sales statistics by quarter (use the pull-down). Yes, the news is depressing. But it’s undeniably informative. And share-able. What information can your business repackage in such a way that people will want to share it?

Boost your office productivity with a bigger screen

Over the years, many of my co-workers have used two monitors to get work done. Others have swapped “standard issue” monitors for larger ones. Their explanation is always the same. Information work is all about work space real estate, and these set-ups make them more productive. Evidence has suggested to me that they’re right. Now from the Wall Street Journal comes further validation.

This piece reports on a study that was financed by NEC, but vetted by a more objective body (the university’s research board):

Researchers at the University of Utah tested how quickly people performed tasks like editing a document and copying numbers between spreadsheets while using different computer configurations: one with an 18-inch monitor, one with a 24-inch monitor and with two 20-inch monitors. Their finding: People using the 24-inch screen completed the tasks 52% faster than people who used the 18-inch monitor; people who used the two 20-inch monitors were 44% faster than those with the 18-inch ones.

The conclusion is a worker could save upwards of 2.5 hours a day by using a bigger monitor. This is far more than I would have expected.

Do you use a monitor that’s around 24-inch? Or two? If so, I assume you have the free time to comment. As for me? I’m writing this on my lunch break, with little time to spare. I need a bigger monitor baaaddd!

Looking for ways to promote your cause? Look no further than this Conversation Bum Rush

As marketing technologists, we are like entomologists in a thriving new ecosystem. Everywhere you look there are new species of creatures flitting about, evolving — it seems — right before our eyes. They may use similar techniques for survival and reproduction, but the combinations employed vary slightly from one to the next, and by observing the most successful species, you can learn much about surviving yourself in this teeming Web 2.0 forest.

Now don your pith helmets, and behold the authors of a book on social media. You will not encounter a more highly adaptive critter. How do they thrive?

Well, you wouldn’t expect them to typically run ads in the New York Times, or on the sides of cabs, for that matter. To promote the latest edition of their book, they are practicing what they preach. And they will succeed.

Watch and learn.

Join the Age of Conversation Bum Rush on March 29thOn March 29, join a social media movement (and help a good cause) by purchasing the latest Age of Conversation. And for an excellent blueprint for promoting the book, read Chris Wilson’s blog entry on the campaign (by way of David Berkowitz). The tactics Chris outlines are how the most successful social media “creatures” are surviving in this thrilling — and dangerous — new media jungle.

Watch and learn.

And, come the end of March, buy the book!

WhoIsSick.org: A mash-up that proves misery loves company

Musical genius Tom Waits once quipped, “Everybody I like is either dead or not feeling well.” This week I took comfort in these words as I was in the throes of a terrible cold. Everyone I knew, it seemed, was either sick or succumbing. As often happens, this got me wondering how widespread the virus really was.

In the past I’ve been frustrated. Maps of everyday pandemics aren’t easily come by. But today I got an emailed link to an interesting new Google mash-up. The link was sent to me by friend and lighting designer extraordinaire Noele Stollmack (who has been begging me to mention her in my blog for months*). A bit of an amateur epidemiologist herself, she confessed in her email that WhoIsSick.org is the “first social networking site that has piqued my interest.”

Click on this image for an expanded view of the sick people in NYC in the last 60 daysNoele is actually jumping the gun a bit. It may become a social network someday, but for now it’s a promising database / mapping application showing the spread and concentration of collections of symptoms. Participation is still quite low, but I like the concept. The image at the right shows a tag cloud of the symptoms reported in the Manhattan area. If you click on the image you’ll get an expanded view that shows the NYC Google Map with the distribution of these symptoms.

How are you feeling? If the answer is not well, go to WhoIsSick and type in your ZIP code. You’ll see who else is sick in your area, and have a chance to add your malady to the mix.

Try it. It might make you feel a little better.


*Actually, Noele Stollmack finds blogs “too personal and self-indulgent” to waste her time with, which is reason enough for me to create this Google bomb that ranks high when anyone searches on the phrase noele stollmack. 🙂 Back atcha, Noele!